
Revision history (first version, published Feb 22, 2026)
- First published
Cite this article(DOI: 10.5281/zenodo.21614452)
This article is archived on Zenodo. Below are both the DOI that always resolves to the latest version and the DOI pinned to the version you are reading.
Go Komura (2026). An Introduction to HCP Charts and MakingHCPChartSkill. KomuraSoft LLC. https://doi.org/10.5281/zenodo.21614452 https://staging.comcomponent.com/en/blog/2026/02/22/000-what-is-hcp-chart-and-making-hcp-chart-skill/
- DOI (latest version)
- 10.5281/zenodo.21614452
- DOI (this version)
- 10.5281/zenodo.21614453
Table of Contents
- What Is an HCP Chart?
- The Problem This Repository Solves
- Grasping the Repository Layout in the Shortest Time
- A 10-Minute Hands-On (GCD Sample)
- How to Read the Two Samples
- What Happens Inside (HCP Chart)
- Conclusion
When you want HCP charts to be “diagrams you can read as specifications,” hand-drawn diagrams alone become hard to maintain.
MakingHCPChartSkill is a skill repository for interpreting HCP-DSL (text) according to the specification and returning deterministic SVG.
In this article, we start from the basics of HCP charts and go all the way through actually running the tool.
1. What Is an HCP Chart?
An HCP chart is a notation for describing processing hierarchically. In this repository, the following writing style is treated as a mandatory rule.
- The left side states “what to achieve (the goal)”
- The right side (deeper indentation) states “how to achieve it (means and details)”
- The top level (level 0) carries a goal label
By writing text along these rules, the correspondence between design intent and implementation detail becomes easy to read.
2. The Problem This Repository Solves
When diagrams are managed by hand alone, problems like these tend to occur.
- The diagram and the specification text drift apart
- Constraints on branching and hierarchy become vague
- Diff reviews are difficult
With MakingHCPChartSkill, you pass HCP-DSL as a JSON request, and hcp_render_svg.py performs validation and rendering.
The same input always yields the same output, which makes it easy to incorporate the diagrams into CI and reviews.
3. Grasping the Repository Layout in the Shortest Time
Target repository: https://github.com/gomurin0428/MakingHCPChartSkill
hcp-chart-svg-v2/SKILL.mdHow to use the skill and its constraints (e.g.,renderAllModulesandmodulecannot be specified together).hcp-chart-svg-v2/scripts/hcp_render_svg.pyThe core script that validates the JSON input, interprets the HCP-DSL, and returns the SVG response.hcp-chart-svg-v2/references/Specification reference, sample request/response, sample SVG.hcp-chart-svg-v2/scripts/hcp_xml_to_svg.pyDeprecated. Usehcp_render_svg.pynow.
4. A 10-Minute Hands-On (GCD Sample)
4.1. Clone the Repository
git clone https://github.com/gomurin0428/MakingHCPChartSkill.git
cd .\MakingHCPChartSkill
4.2. Install the Skill into Your Local Codex
Copy-Item -Recurse -Force .\hcp-chart-svg-v2 "$HOME\.codex\skills\hcp-chart-svg-v2"
4.3. Generate the SVG Response from the Sample Input
python .\hcp-chart-svg-v2\scripts\hcp_render_svg.py `
  --input .\hcp-chart-svg-v2\references\example-gcd-request.json `
  --output .\hcp-chart-svg-v2\references\example-gcd-response.json `
  --pretty
4.4. Extract the SVG from the Response JSON
$r = Get-Content -Raw .\hcp-chart-svg-v2\references\example-gcd-response.json | ConvertFrom-Json
$r.svg | Set-Content -NoNewline -Encoding utf8 .\hcp-chart-svg-v2\references\example-gcd.svg
4.5. Notes (Input Constraints)
- When
renderAllModules=true,modulecannot be specified. - If
diagnosticscontains anerror,svgorsvgswill be empty.
5. How to Read the Two Samples
5.1. Euclid’s Algorithm (GCD)
- Sample input:
example-gcd-request.json - Sample output:
example-gcd-response.json
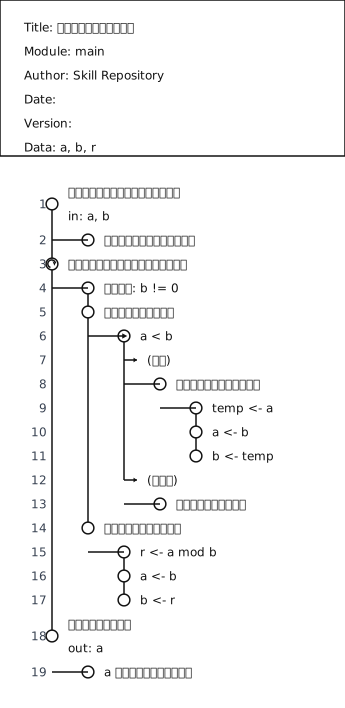
“Receiving input,” “iterating,” and “returning” are separated hierarchically, making the goals and means of the processing easy to follow.
5.2. Order Approval Flow
- Sample input:
example-order-approval-request.json - Sample output:
example-order-approval-response.json
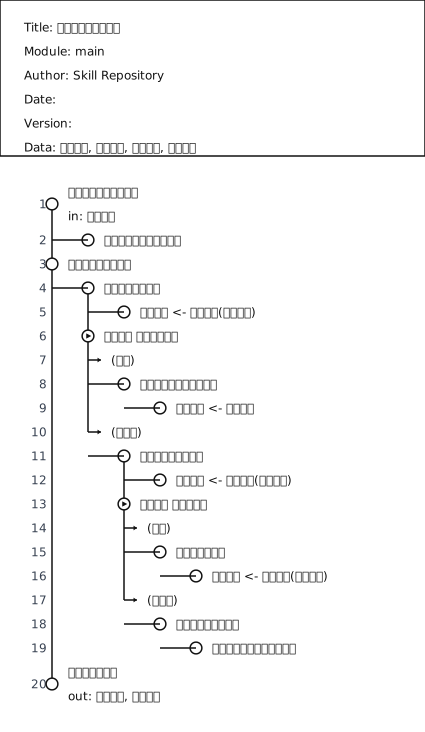
Even for business workflows, fork and true/false let you describe the intent of each branch clearly.
6. What Happens Inside (HCP Chart)
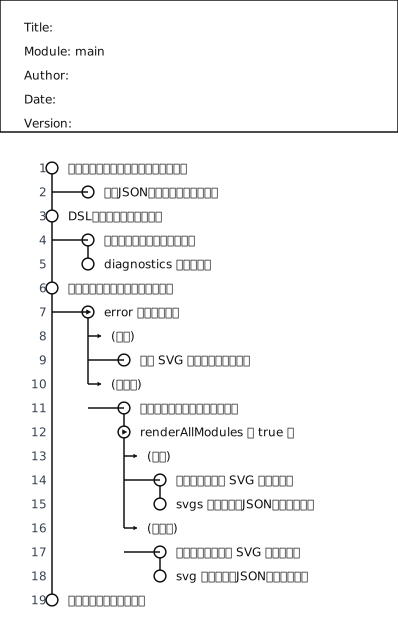
Written in HCP-DSL, the processing flow of execute_request looks like this.
\module main
Receive the request and check the prerequisites
    Validate the required fields of the input JSON
Parse the DSL into a structure
    Interpret the modules and hierarchy
    Collect diagnostics
Choose the response path based on the diagnostics
    \fork does an error exist
        \true yes
            Return empty SVG-related payloads
        \false no
            Determine the modules to render
            \fork is renderAllModules true
                \true yes
                    Generate SVG for all modules
                    Assemble the response JSON containing svgs
                \false no
                    Generate SVG for a single module
                    Assemble the response JSON containing svg
Return the result to the caller
Here is the diagram produced by actually rendering the DSL above.
7. Conclusion
The strength of HCP charts is not just that they are easy to read as diagrams - they can be managed in a form you can treat as a specification.
With MakingHCPChartSkill, you can validate HCP-DSL and generate SVG from it in one consistent pipeline.
As a next step, try writing one of your everyday processing specifications in HCP-DSL and refining it while watching diagnostics - that is the easiest way to feel the benefit.
References
Related Articles
Recent articles sharing the same tags. Deepen your understanding with closely related topics.
Never Use a QR Code's Decoded Value As-Is — Error Correction Succeeding Does Not Guarantee the Value
QR code error correction is not a mechanism that guarantees the value is correct once correction succeeds. Using sample images and measur...
Stop Using Write-Host — PowerShell Output Streams and Log Design
How to choose between PowerShell's six output streams, the problems with Write-Host and where it genuinely belongs, why function return v...
Code Design for Business Systems — Deciding Product and Customer Codes, and Check Digits
A practical guide to deciding the code scheme for a business system, including product and customer codes. Covers a decision table for me...
An Introduction to ADRs (Architecture Decision Records) — The Minimal Way to Record 'Why We Designed It This Way' on a Small Team
Code never explains why it was written that way. We cover how to use an ADR (Architecture Decision Record) — one decision, one Markdown f...
Don't Forget to Decide 'How Many Seconds Is Fast Enough' — Organizing Non-Functional Requirements With IPA's Non-Functional Requirements Grade
Disputes like 'it's too slow' or 'we didn't expect that failure response' usually trace back to non-functional requirements nobody decide...
Related Topics
These topic pages place the article in a broader service and decision context.
Windows Technical Topics
Topic hub for KomuraSoft LLC's Windows development, investigation, and legacy-asset articles.
Where This Topic Connects
This article connects naturally to the following service pages.
Technical Consulting & Design Review
This topic is about organizing designs and processing flows into a visible form, so it fits naturally in the context of technical consulting and design review.
Frequently Asked Questions
Common questions about the topic of this article.
- What is an HCP chart?
- An HCP chart is a notation for describing processing hierarchically. The left side states what to achieve (the goal), the right side at deeper indentation states how to achieve it (means and details), and the top level carries a goal label. Writing text along these rules makes the correspondence between design intent and implementation detail easy to read, so the diagrams can be treated as specifications.
- What problem does MakingHCPChartSkill solve?
- When diagrams are managed by hand alone, the diagram and the specification text drift apart, constraints on branching and hierarchy become vague, and diff reviews are difficult. MakingHCPChartSkill takes HCP-DSL as a JSON request and renders it with a script that performs validation and rendering. The same input always yields the same SVG output, which makes it easy to incorporate the diagrams into CI and reviews.
- How do I generate an SVG from HCP-DSL with MakingHCPChartSkill?
- Clone the MakingHCPChartSkill repository from GitHub and run hcp_render_svg.py with an input JSON request and an output path. The script validates the JSON, interprets the HCP-DSL, and returns a response JSON containing the SVG, which you can then extract to a file. The repository includes sample requests such as a GCD (Euclid's algorithm) example and an order approval workflow.
- What are the input constraints when rendering HCP charts?
- There are two main constraints. When renderAllModules is set to true, you cannot also specify a single module - the two options are mutually exclusive. And if the diagnostics in the response contain an error, the svg and svgs fields will be empty, so you should refine the DSL while watching the diagnostics output.